Stock Technical Analysis - 5 Key Indicators
What is Technical Analysis?
Instead of looking at company profits, technical analysis looks at price patterns and tries to predict where the price will go next. It uses charts, lines, and math formulas to spot trends. Think of it like reading the mood of the market using past price data.
A. SMA (Simple Moving Average)
Explanation
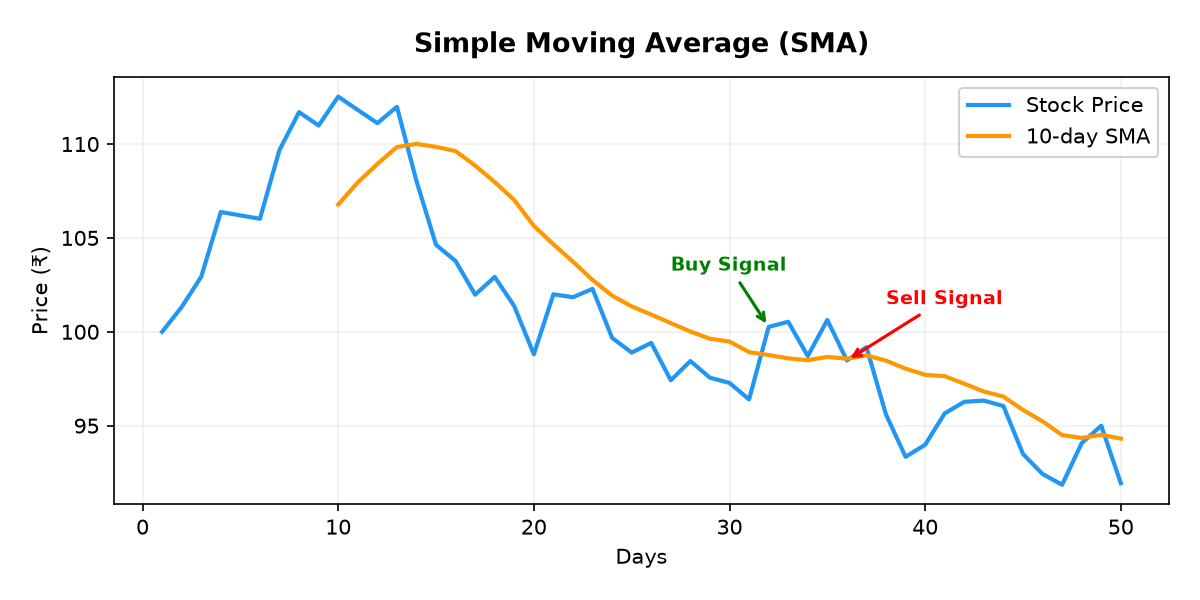
The average price of a stock over the last N days. It smooths out the day-to-day ups and downs so you can see the overall direction.
Formula
Let's put in real numbers:
5-day SMA = (100 + 102 + 98 + 105 + 103) / 5
= 508 / 5
= ₹101.6
What it tells you
Price below SMA = stock is in a downtrend (bearish).
B. EMA (Exponential Moving Average)
Explanation
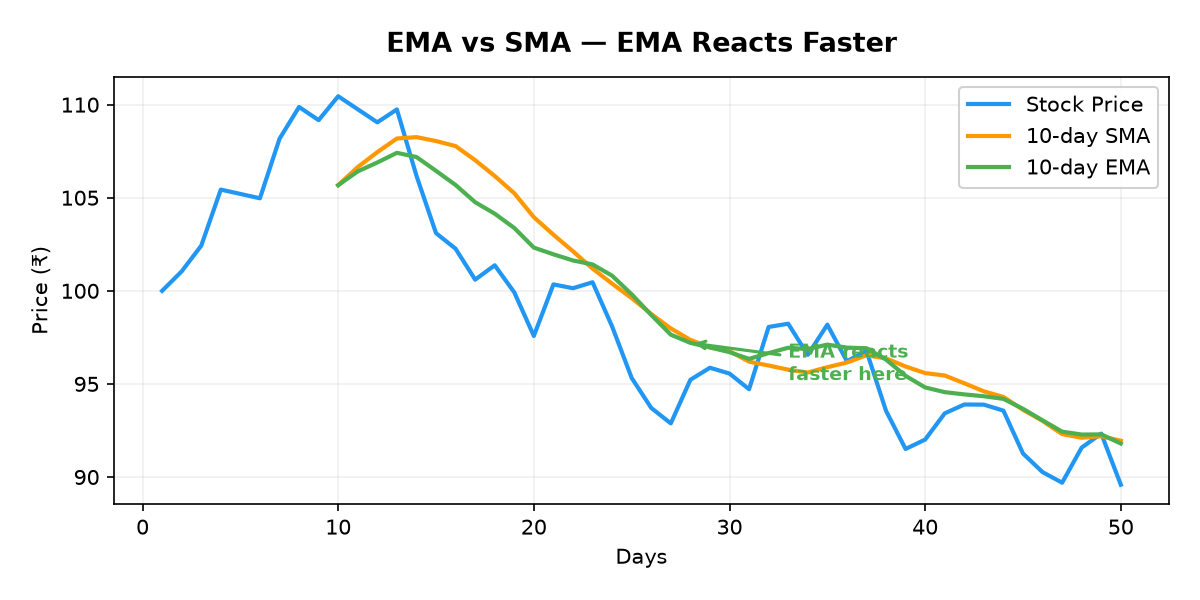
Like SMA but gives more weight to recent prices. This means it reacts faster when prices change suddenly.
Formula
where k = 2 / (N + 1)
Let's put in real numbers:
Yesterday's EMA was ₹101, today's price is ₹107.
EMA = 107 × 0.333 + 101 × 0.667
= 35.6 + 67.4
= ₹103
Notice: The EMA (103) jumped closer to today's price (107) than a simple average would.
What it tells you
When the price crosses above the EMA, it could mean the start of an uptrend.
C. RSI (Relative Strength Index)
Explanation
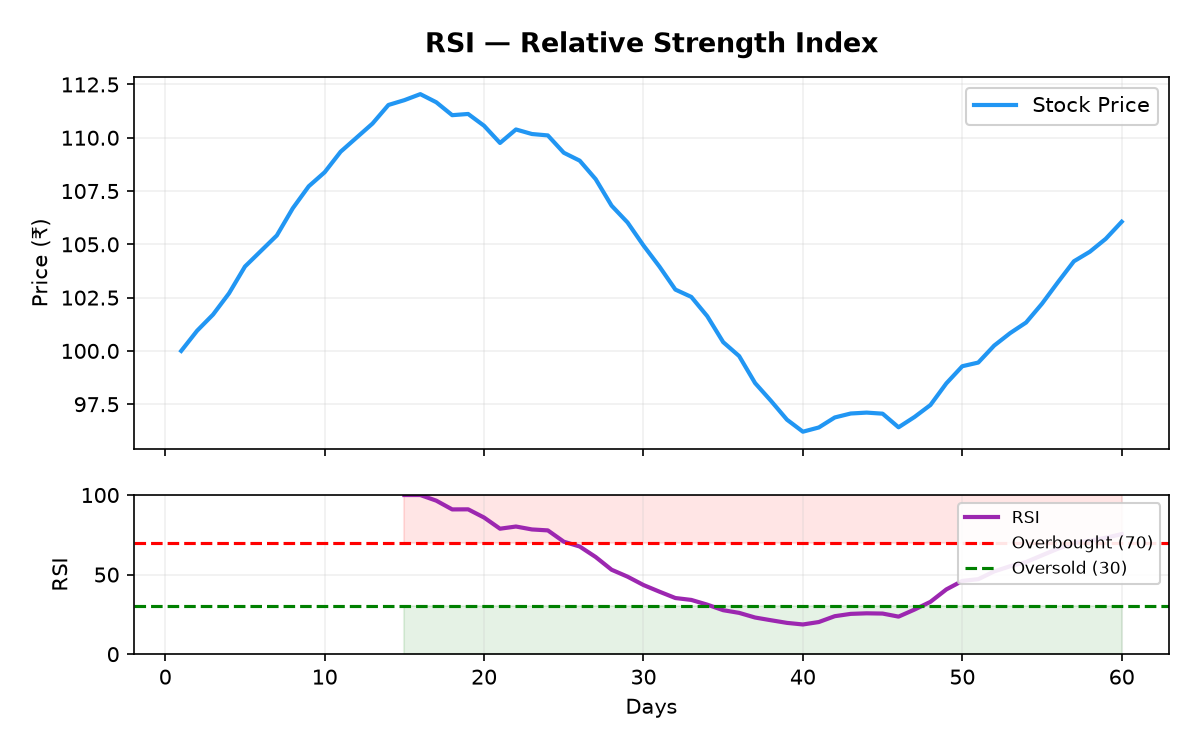
Tells you if a stock is overbought (too expensive, everyone already bought it) or oversold (too cheap, everyone already sold it). It gives a score from 0 to 100.
Formula
where RS = Average Gain / Average Loss (over 14 days)
Let's put in real numbers:
Average gain per day = ₹3, Average loss per day = ₹2
RS = 3 / 2 = 1.5
RSI = 100 - (100 / (1 + 1.5))
= 100 - (100 / 2.5)
= 100 - 40
= 60
RSI of 60 means the stock is neither overbought nor oversold - it is in neutral territory.
What it tells you
RSI < 30 = Stock might be too cheap. It could rise soon (oversold).
RSI around 50 = Neutral, no strong signal.
D. Bollinger Bands
Explanation
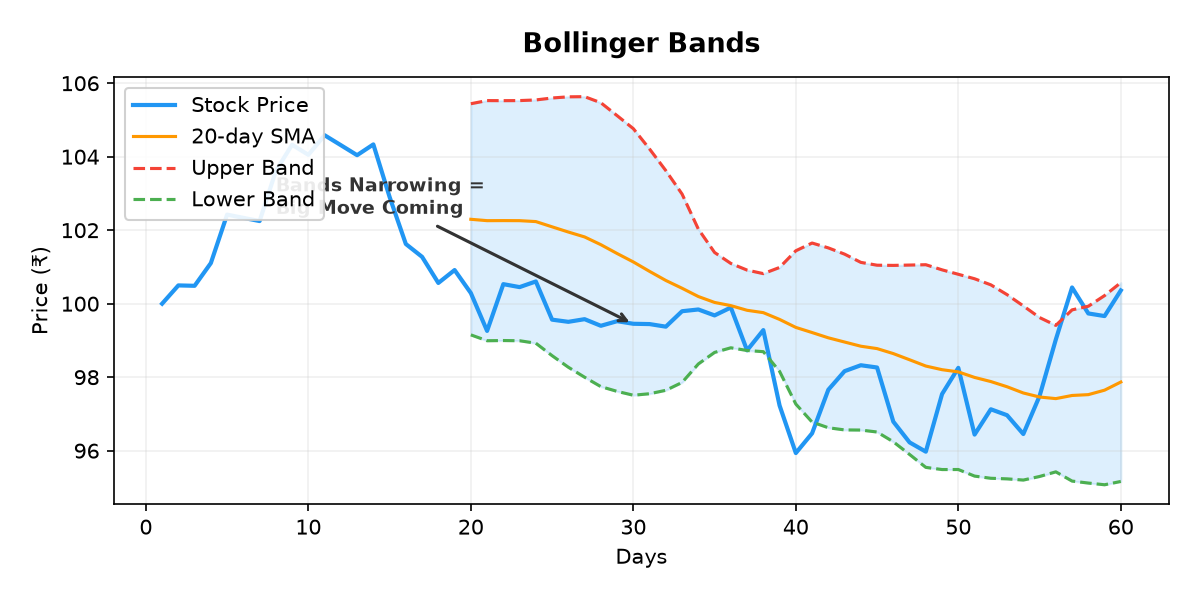
A band (like a channel) drawn around the price that shows if the stock is moving too much or too little. When price goes outside the band, something unusual is happening.
Formula
Upper Band = SMA + 2 × Standard Deviation
Lower Band = SMA - 2 × Standard Deviation
Let's put in real numbers:
Upper Band = 500 + (2 × 20) = ₹540
Middle Band = ₹500
Lower Band = 500 - (2 × 20) = ₹460
So the price should normally stay between ₹460 and ₹540. If it breaks out, pay attention!
What it tells you
Price near lower band = Stock might be oversold, could rise.
Bands getting narrow = A big price move is coming soon (called a "squeeze").
E. MACD (Moving Average Convergence Divergence)
Explanation
Shows whether a trend is getting stronger or weaker. It compares two moving averages and tells you when momentum is shifting.
Formula
Signal Line = 9-day EMA of the MACD Line
Histogram = MACD Line - Signal Line
Let's put in real numbers:
12-day EMA = ₹520, 26-day EMA = ₹510
MACD Line = 520 - 510 = 10
Signal Line (from previous calculations) = 7
Histogram = 10 - 7 = 3 (positive = bullish)
Since MACD (10) is above Signal (7), momentum is positive - the uptrend is getting stronger.
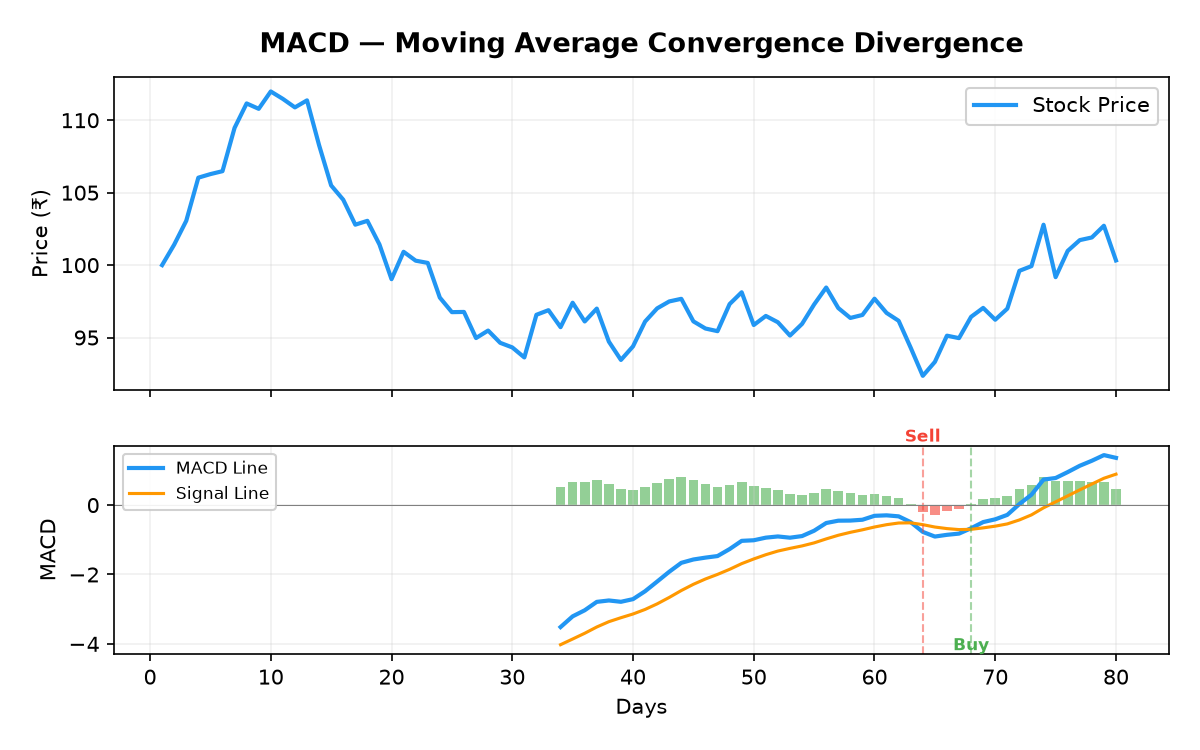
What it tells you
MACD crosses below Signal = Sell signal (bearish crossover).
Histogram growing = Trend getting stronger. Histogram shrinking = Trend weakening.
Quick Reference Table
| Indicator | What It Shows | Buy Signal | Sell Signal |
|---|---|---|---|
| SMA | Average price trend | Price crosses above SMA | Price crosses below SMA |
| EMA | Fast-reacting trend | Price crosses above EMA | Price crosses below EMA |
| RSI | Overbought/Oversold | RSI rises above 30 (from below) | RSI drops below 70 (from above) |
| Bollinger Bands | Price volatility range | Price bounces off lower band | Price touches upper band |
| MACD | Trend strength & direction | MACD crosses above Signal | MACD crosses below Signal |