Stock Fundamental Analysis - A Simple Guide
What is Fundamental Analysis?
Think of it like checking a car before buying it. You look under the hood, check the mileage, see if there's any damage. Fundamental analysis is the same thing, but for companies.
You look at a company's money situation - how much it earns, how much it owes, and whether it's growing. If the numbers look healthy, the stock is probably a decent buy. If not, you might want to stay away.
Key Parameters (The Numbers That Matter)
P/E Ratio (Price to Earnings)
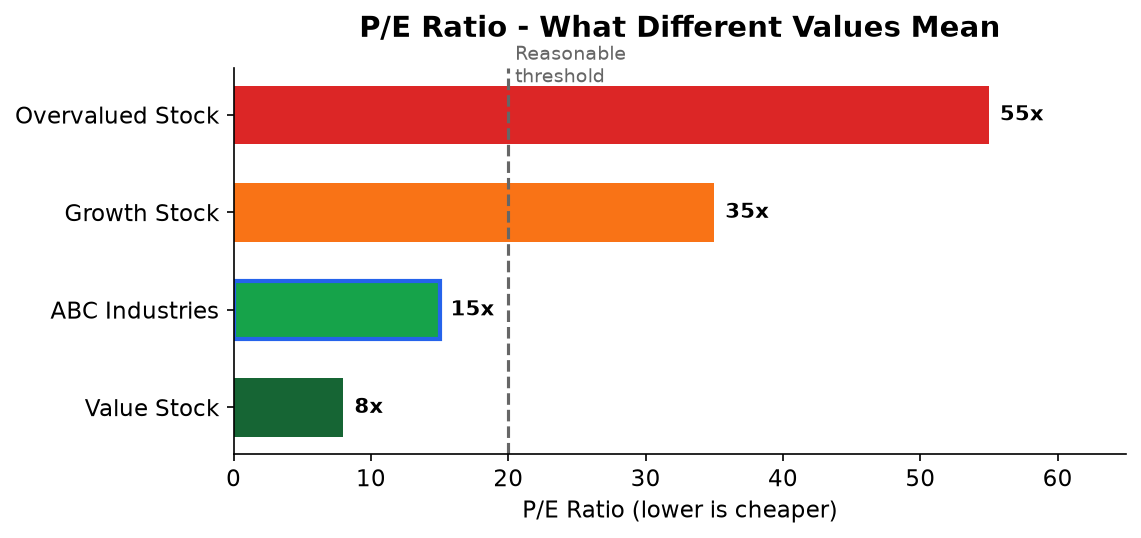
How many years of profits you're paying for
Explanation: If a stock costs 450 and earns 30 per share per year, you're paying 15 years worth of earnings. Think of it like buying a business - a P/E of 15 means it takes 15 years of profits to get your money back (if everything stays the same).
P/B Ratio (Price to Book Value)
Are you paying more than the company is actually worth on paper?
Explanation: Book value is like the net worth of a company (what it owns minus what it owes, divided by total shares). If P/B is 2, you're paying double what the company is worth on paper. Below 1 means you're getting a discount.
Debt to Equity Ratio
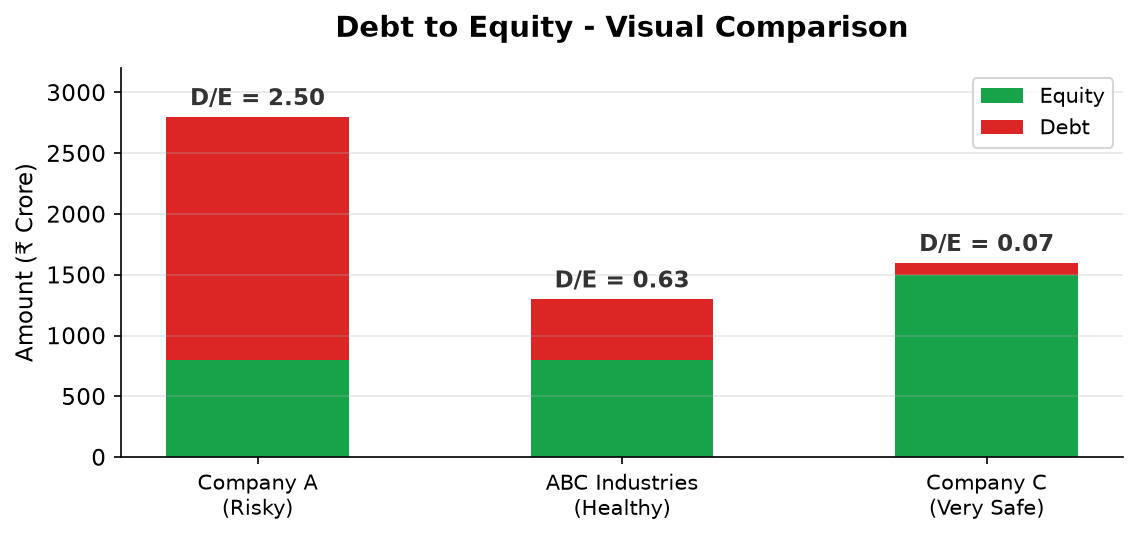
How much the company has borrowed compared to what it owns
Explanation: Imagine you bought a house worth 50 lakhs but took a loan of 30 lakhs. Your debt-to-equity is 30/20 = 1.5. For companies, lower is safer. A company with too much debt can get into trouble if business slows down.
Return on Equity (ROE)
How good is the company at making money with shareholders' investment?
Explanation: If you gave 100 to a friend's business and they made 25 profit from it, their ROE is 25%. Higher ROE means the company is really good at turning your investment into profit.
Earnings Per Share (EPS)
How much profit does each share earn?
Explanation: If a company made 100 crore profit and has 10 crore shares, each share earned 10. Higher EPS means the company is earning more money for each share you own. You want this number to grow every year.
Revenue Growth (Year over Year)
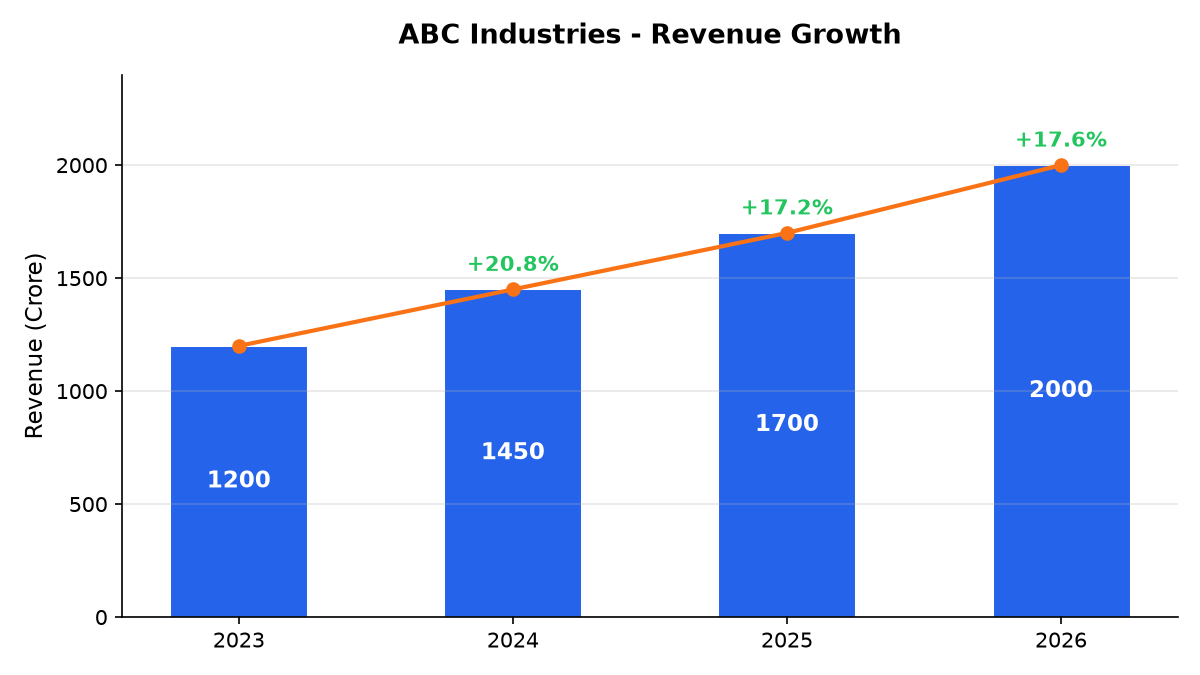
Is the company selling more stuff than last year?
Explanation: If a shop made 10 lakhs last year and 12 lakhs this year, it grew by 20%. Growing revenue means more customers or higher sales. A company that's not growing might be in trouble.
Dividend Yield
How much cash do you get back each year just for holding the stock?
Explanation: Some companies share their profits with shareholders as cash dividends. If you buy a stock at 450 and get 10 back each year as dividend, your yield is about 2.2%. It's like getting interest on a fixed deposit, but from a company.
Promoter Holding
How much of the company do the founders/owners still own?
Explanation: Promoters are the people who started or control the company. If they own a big chunk (50%+), it usually means they believe in their own company. If they're selling their shares, it might be a red flag - would you stay on a ship the captain is leaving?
Grading a Stock - Example
ABC Industries - Report Card
Let's calculate each number for a dummy company and give it a grade, just like in school.
| Company Data | |
| Stock Price | ₹450 |
| EPS | ₹30 |
| Book Value per Share | ₹200 |
| Total Debt | ₹500 Cr |
| Total Equity | ₹800 Cr |
| Net Profit | ₹200 Cr |
| Revenue (this year) | ₹2000 Cr |
| Revenue (last year) | ₹1700 Cr |
| Dividend per Share | ₹10 |
| Promoter Holding | 62% |
Calculations & Grades:
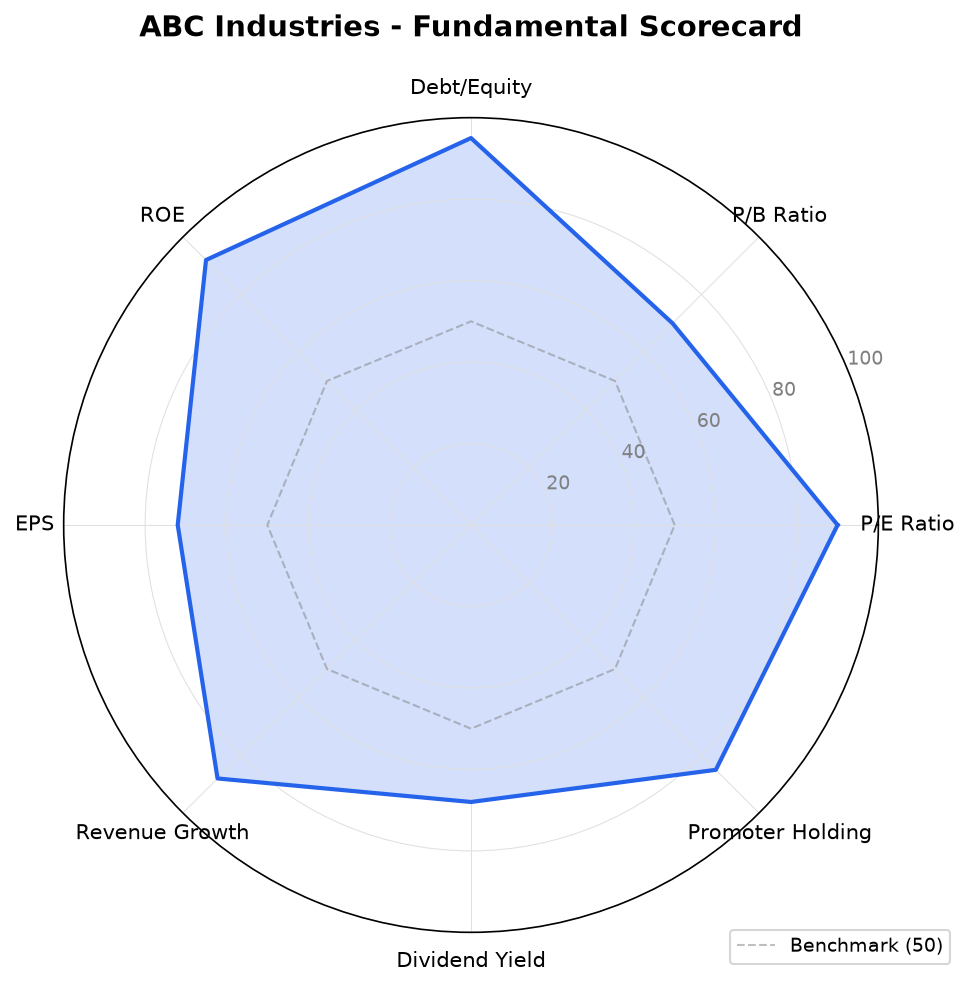
Visual Scorecard
5 A's and 3 B's - ABC Industries looks like a healthy company!
How to Use This
Simple rule: Before buying any stock, check these numbers. If most parameters show A or B grade, the company is financially strong. If you see mostly C or D, be careful.
No single number tells the full story. A company might have great ROE but too much debt. Always look at the full picture - all 8 parameters together. Also compare with other companies in the same industry (comparing a bank with an IT company doesn't make sense).
Check these numbers once every quarter (every 3 months) when companies release their results. If you see grades dropping over time, it might be time to reconsider your investment.